Beer Price Ceilings and Joint Pricing in Sports Venues: A Yankee Stadium Application
price controls, sports economics, alcohol policy, monopoly pricing, complementary goods, selection effects
1 Abstract
Sports venues jointly price tickets and concessions. This paper asks how a profit-maximizing venue responds when regulators cap beer prices but leave tickets unconstrained. I build a calibrated partial-equilibrium model of Yankee Stadium with drinkers and non-drinkers, utility-consistent beer demand, and attendance that responds to beer consumer surplus.
The benchmark matches an $80 ticket, a $12.50 beer, 85.0% capacity use, and 1.00 beers per attendee. Under a binding $6 ceiling, the stadium raises tickets to $127, attendance falls to 24,752, and beer sales rise +90.2%.
The mechanism is joint pricing: cheaper beer changes both intensive drinking and attendee composition. The exercise is not causal, but it suggests that concession price ceilings may be poorly targeted when alcohol harms are the policy concern.
JEL Codes: D42, L12, L83
Keywords: price controls; sports economics; alcohol policy; monopoly pricing; complementary goods; selection effects
2 Introduction
Recent reporting suggested that New York policymakers were considering whether “unconscionable pricing” statutes could reach stadium concessions (Semafor Staff 2025). That raises a narrower economic question: what happens when a monopolist that jointly prices tickets and beer faces a cap on beer prices?
Beer and tickets are complementary goods. A cheaper beer increases the value of attending for some fans, while a more expensive ticket changes the pool of fans who attend. If the venue controls both prices, a beer ceiling is not just a concession policy; it is a joint-pricing intervention. A useful counterfactual therefore allows the stadium to re-optimize ticket prices rather than holding them fixed.
This paper studies that re-optimization problem with a calibrated partial-equilibrium model of Yankee Stadium. The sports-economics literature has long noted that tickets and concessions need to be analyzed jointly (Coates and Humphreys 2007; Krautmann and Berri 2007). The two main modeling choices are deliberate: the model separates drinkers from non-drinkers, and it lets beer prices affect attendance through beer consumer surplus rather than through an ad hoc cross-price elasticity. That makes the selection mechanism explicit.
4 Model
Consumers choose beer from quasilinear utility,
\[U_i(B) = \alpha_i \ln(B + 1) + Y,\]
which yields beer demand
\[B_i(P_B) = \max \left(0, \min \left(\frac{\alpha_i}{P_B} - 1,\; B_{\max}\right)\right).\]
Attendance is modeled in net cost, where beer consumer surplus lowers the effective price of attending for drinkers:
\[A_i(P_T, P_B) = A_{i,0} \cdot \exp\left[-\lambda \left(\text{net cost}_i(P_T, P_B) - \text{net cost}_{i,0}\right)\right].\]
The venue then maximizes
\[\pi = P_T A + P_B^{\text{stadium}} Q - c_T A - c_B Q - k \left(\frac{Q}{1000}\right)^2,\]
where the quadratic term captures internalized crowd-management and experience-degradation costs. External crime and health costs are tracked separately using values informed by the broader alcohol literature (Carpenter and Dobkin 2015; Manning et al. 1991).
4.1 Ticket Markup Condition
The ticket first-order condition separates the ordinary ticket markup from the concession and crowd-cost value of a marginal attendee:
\[P_T - c_T = -\frac{A}{A_T} - \left[m_B(P_B) - C'(Q)\right]\frac{Q_T}{A_T}.\]
The first term is the standalone ticket markup. The second term is the joint-pricing adjustment: if a marginal attendee buys profitable beer, the venue is willing to lower the ticket markup; if the marginal attendee generates beer-related crowd costs above beer margins, the adjustment raises the ticket markup. In the calibrated benchmark, the $6 ceiling both lowers the stadium’s beer margin and makes attendees more beer-intensive, so the crowd-cost adjustment becomes much larger. This mechanism is conditional on the private crowd-cost calibration rather than an independently estimated stadium cost.
The private crowd-cost coefficient has units of dollars per squared thousand beers because \(C(Q)=k(Q/1000)^2\). The marginal internal cost rows below report \(C'(Q)=2kQ/1{,}000{,}000\) dollars per beer.
| FOC component | Baseline | $6 ceiling |
|---|---|---|
| Ticket price | $80.00 | $126.88 |
| Ticket margin | $76.50 | $123.38 |
| Standalone ticket markup | $75.88 | $75.88 |
| Stadium beer margin before crowd costs | $9.41 | $3.44 |
| Marginal internal crowd cost per beer | $10.03 | $19.07 |
| Effective beer margin net of crowd cost | $-0.62 | $-15.63 |
| Marginal attendee beer intensity | 1.00 | 3.04 |
| Concession/crowd-cost ticket adjustment | $0.62 | $47.49 |
5 Calibration and Public Data
The calibrated benchmark targets the reported beer price, a benchmark ticket price, average beer consumption, and baseline attendance. The inputs are intentionally public and low-dimensional:
The calibration uses public or literature-based moments rather than transaction-level Yankees data. The moments are deliberately rounded because the point of the exercise is the joint-pricing mechanism, not a claim to estimate exact Yankees demand.
| Input | Benchmark value | Rationale |
|---|---|---|
| Beer price | $12.50 | Public concession-price reporting and the policy debate motivating the exercise (Semafor Staff 2025). |
| Ticket price | $80.00 | Round benchmark for the effective ticket price faced by a marginal attendee; treated as a calibration target rather than a microdata estimate. |
| Capacity utilization | 85.0% | High-demand regular-season benchmark; the exact attendance level matters less than the implied local ticket elasticity. |
| Drinker share | 40% | Anchored to stadium alcohol-use evidence showing substantial but far from universal drinking among MLB spectators (Wolfe et al. 1998). |
| Beers per attendee | 1.00 | Chosen so the aggregate benchmark combines the drinker share with 2.5 beers per drinker. |
| Beer cap | 6.5 beers | Upper bound on per-person beer demand used consistently in the demand and beer-surplus formulas. |
| Internal crowd cost | $126.73 per squared thousand beers | Coefficient in C(Q)=k(Q/1000)^2. The main ticket-response mechanism is conditional on this private crowd-management and experience-degradation value and is stress-tested below. |
| Alcohol external costs | $4.00 per beer | Imported from broader alcohol-policy evidence; used for welfare accounting, not for the private-pricing mechanism (Manning et al. 1991; Carpenter and Dobkin 2015). |
The two calibrated structural parameters are the semi-log ticket sensitivity and the internalized experience-degradation cost. They are chosen jointly so that the unconstrained venue optimum reproduces the benchmark ticket and beer prices.
The current parameterization implies the following calibration checks:
- Baseline attendance is 85.0% of capacity.
- Drinkers consume 2.50 beers at the benchmark price.
- Drinker share rises from 40.0% to 48.3% under the $6 ceiling.
- These are calibration checks rather than independent validation moments. They document the benchmark region of the parameter space used for the mechanism exercise.
6 Results
6.1 Baseline vs. $6 Ceiling
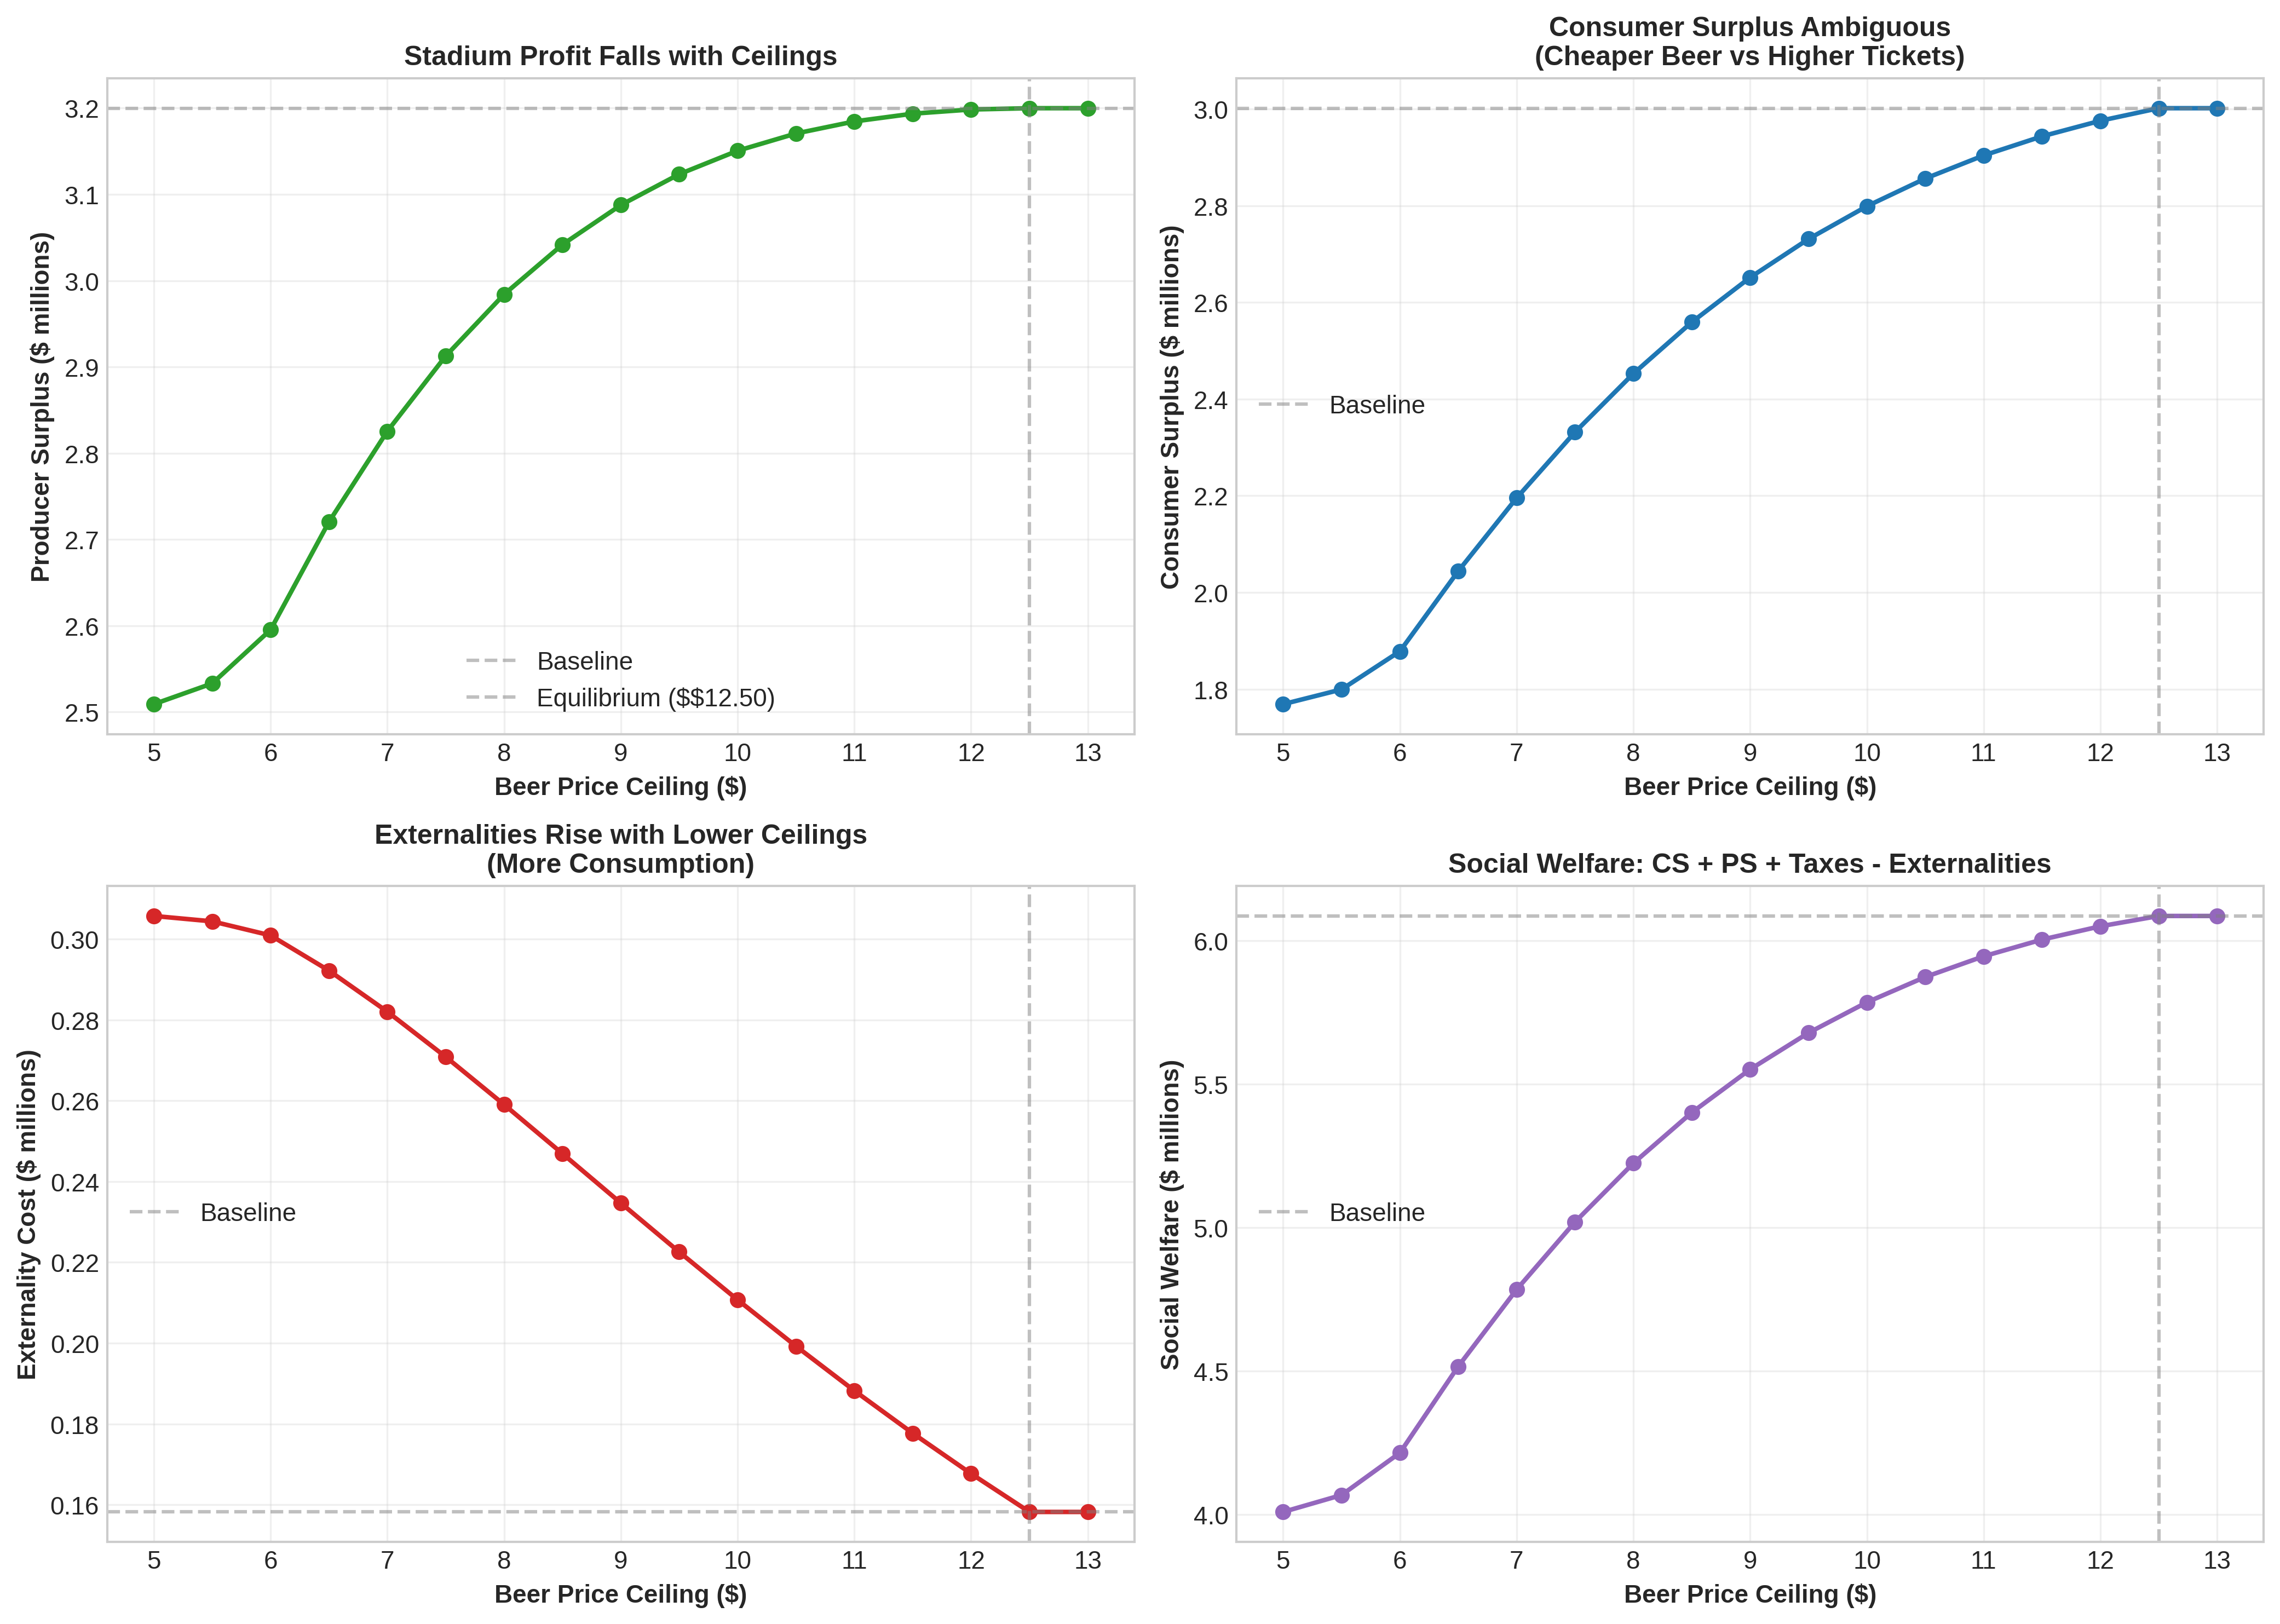
Social welfare is computed as consumer surplus plus stadium profit plus tax revenue minus external alcohol costs.
| Outcome | Baseline | $6 Ceiling | Change |
|---|---|---|---|
| Ticket price | $80.00 | $126.88 | +58.6% |
| Beer price | $12.50 | $6.00 | -52.0% |
| Attendance | 39,556 | 24,752 | -37.4% |
| Drinker share of attendance | 40.0% | 48.3% | +8.3 pp |
| Beers per fan | 1.00 | 3.04 | +203.9% |
| Total beers | 39,556 | 75,221 | +90.2% |
| Stadium profit | $3,199,888 | $2,595,269 | -18.9% |
| Consumer surplus | $3,001,594 | $1,878,218 | -37.4% |
| Tax revenue | $43,233 | $42,357 | -2.0% |
| External alcohol costs | $158,226 | $300,886 | +90.2% |
| Social welfare | $6,086,489 | $4,214,958 | -30.7% |
The basic mechanism is straightforward within the calibrated benchmark. A beer ceiling lowers the direct beer margin and increases beer intensity among attendees. In the calibrated ticket-markup condition, that makes the concession and crowd-cost adjustment to ticket pricing much larger, so the venue shifts toward the unconstrained instrument, ticket price. Attendance falls, but the remaining crowd becomes more drinker-heavy and more beer-intensive. The result should be read as conditional on the model’s private crowd-cost and repricing assumptions, which are stressed below.
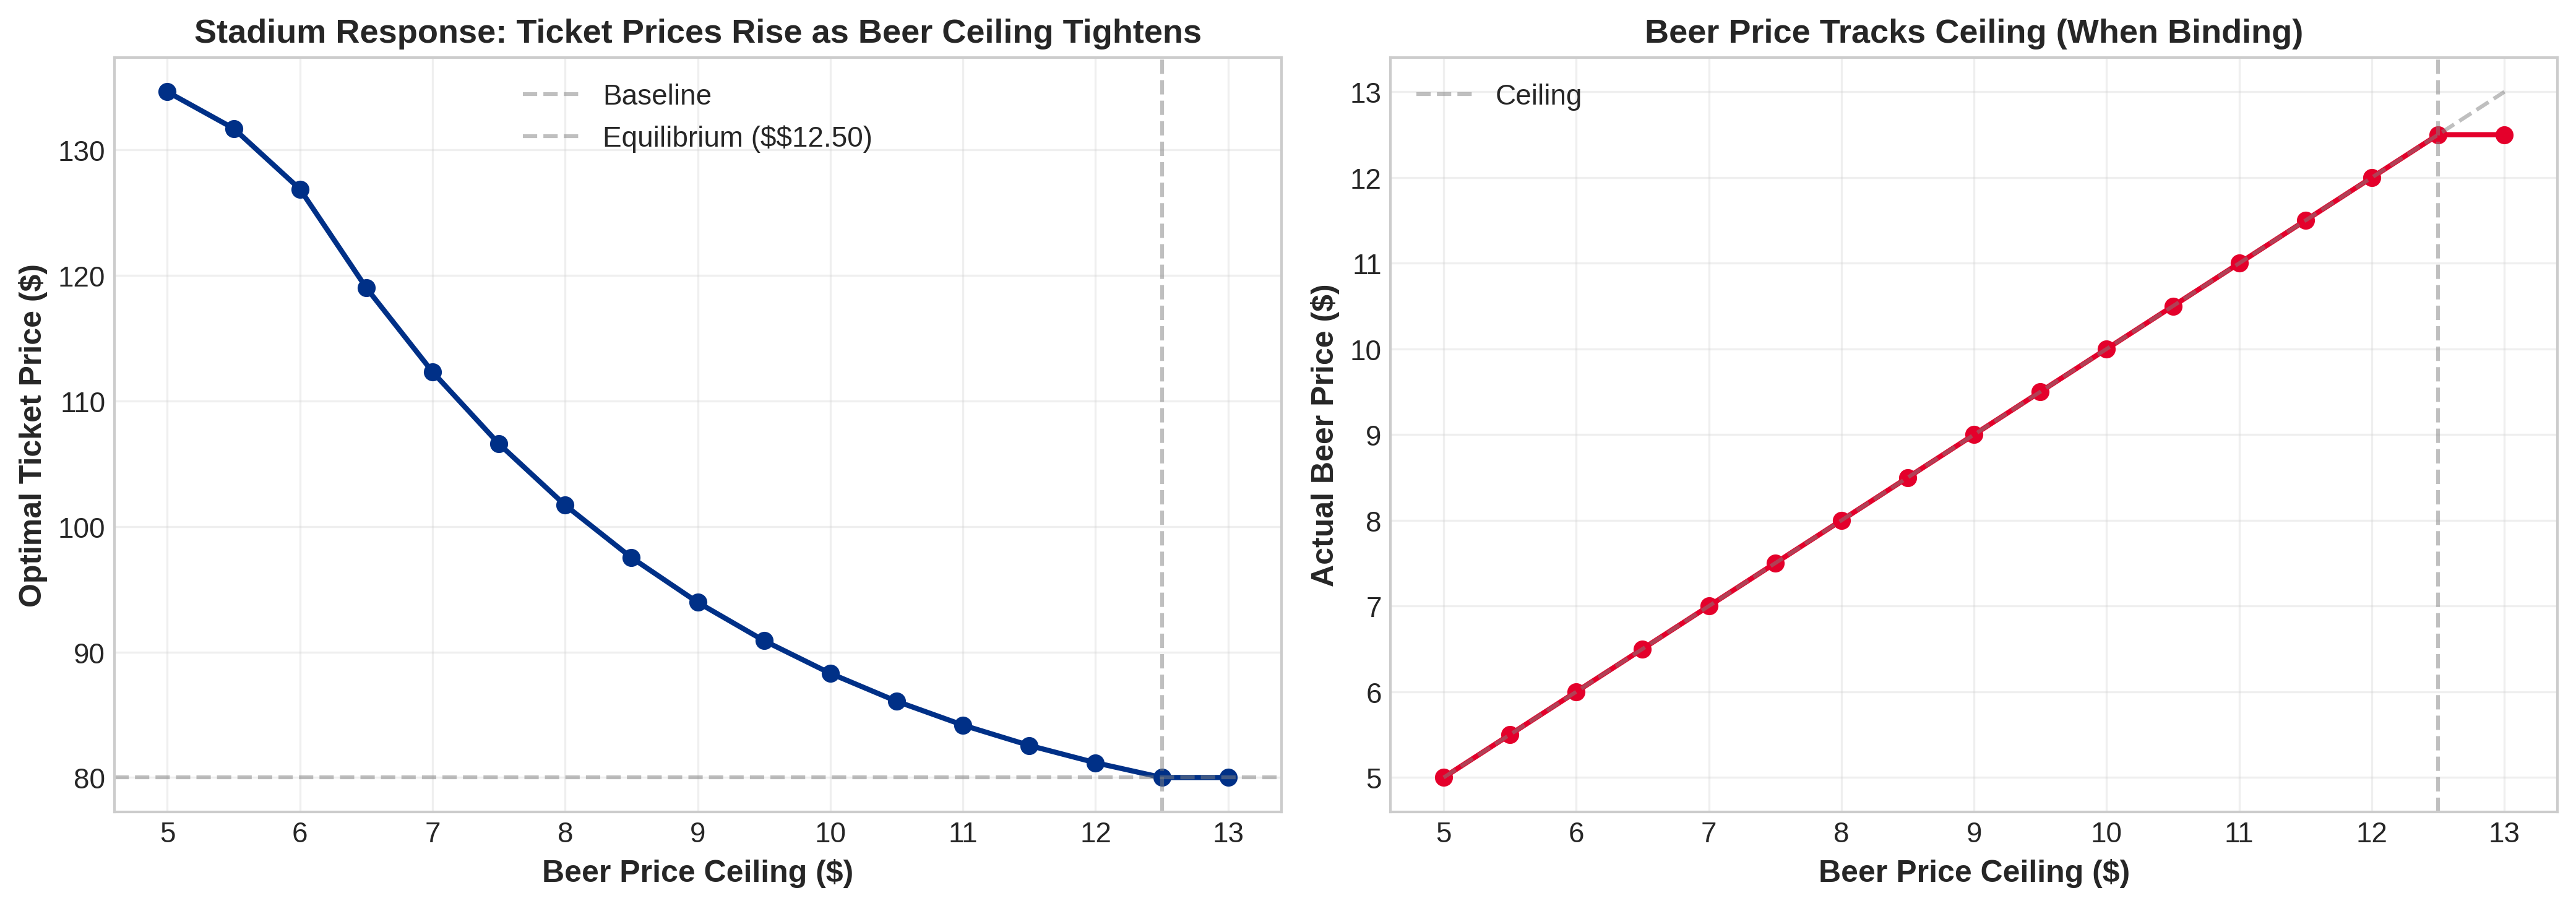
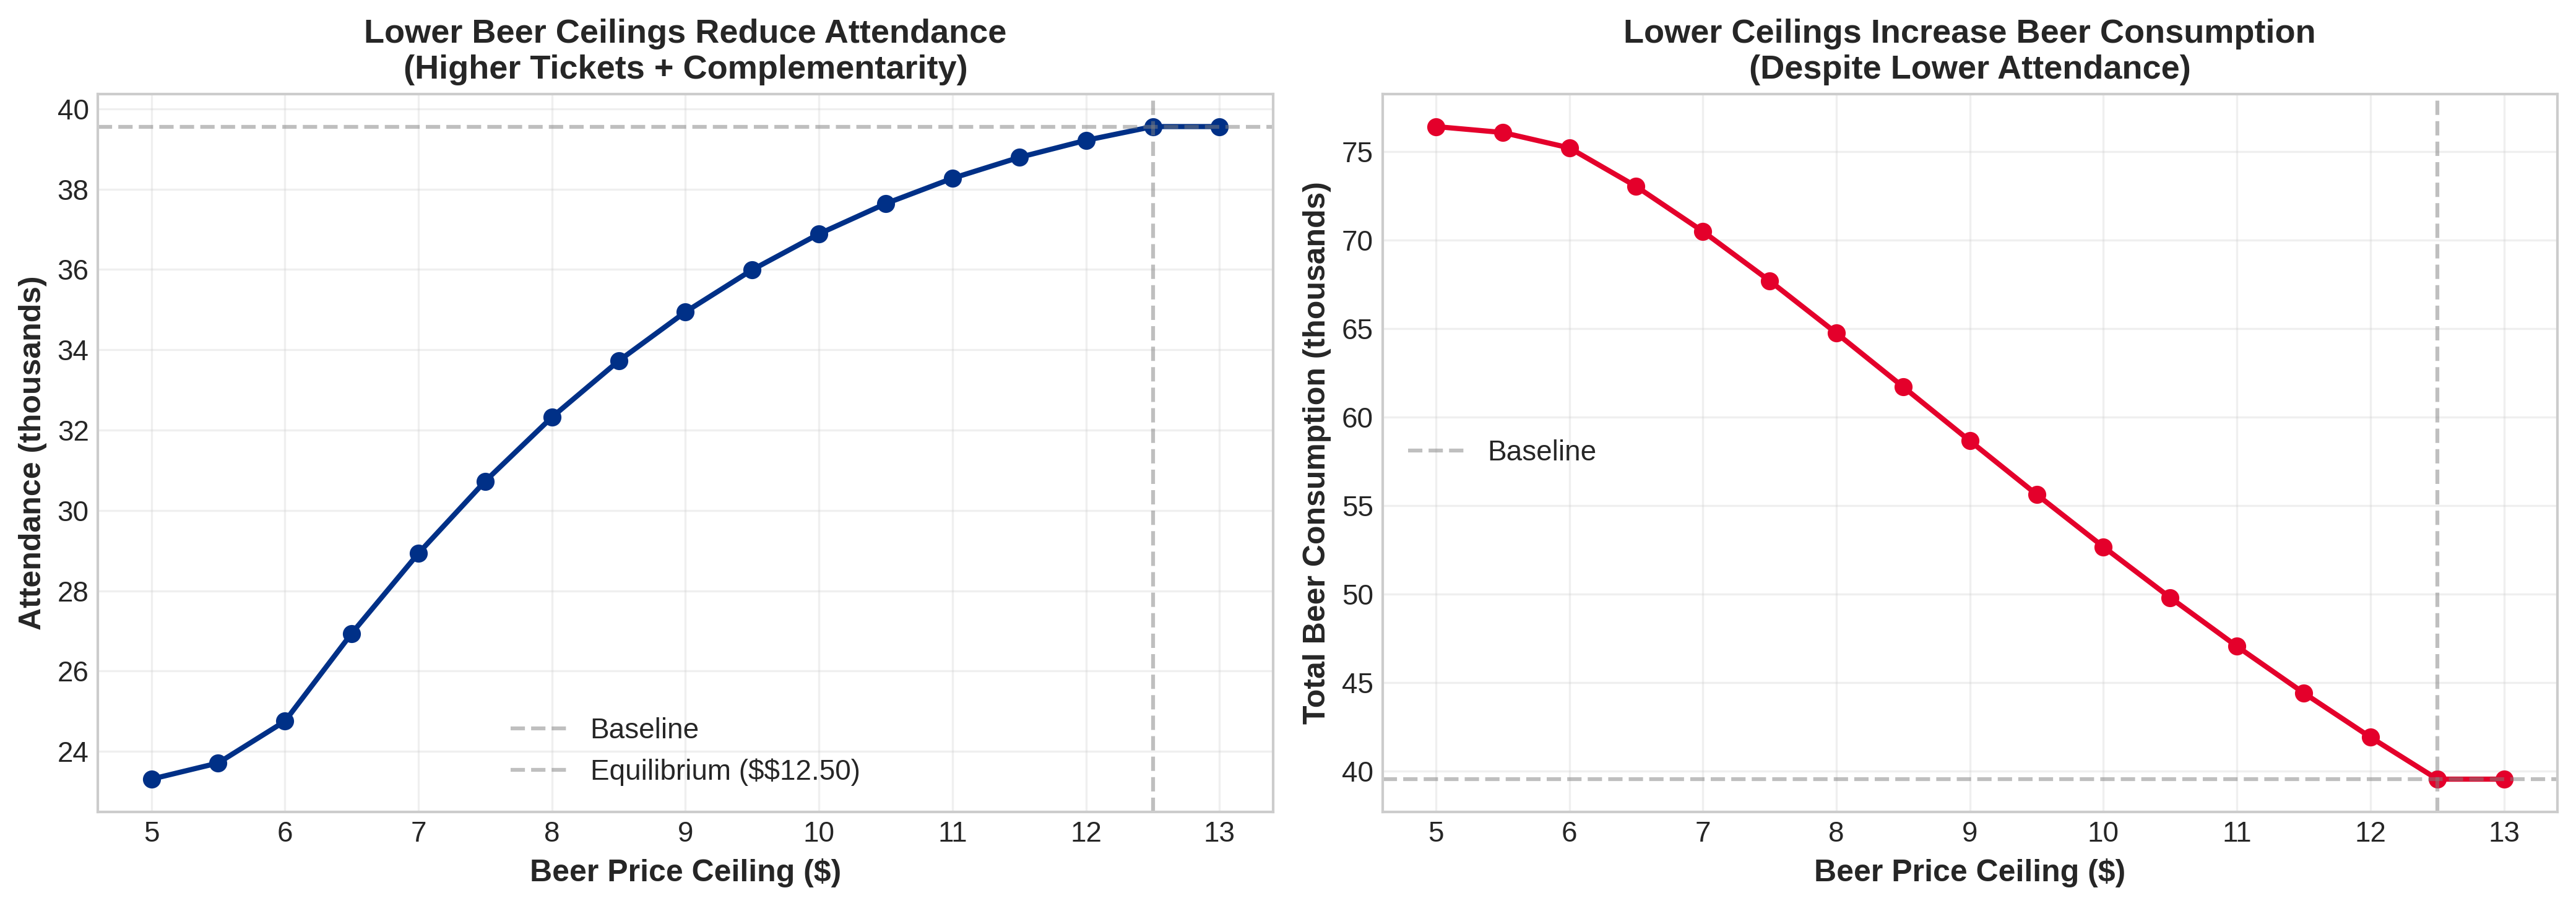
6.2 Ceiling Stringency
The comparative statics are monotonic: tighter ceilings produce larger ticket increases, larger attendance declines, and larger increases in total beer consumption.
Even a relatively mild $10 ceiling, still below the $12.50 benchmark beer price, raises tickets +10.4% and total beer consumption +33.2%.
- At $10, tickets change +10.4%, attendance changes -6.8%, and total beer consumption changes +33.2%.
- At $8, tickets change +27.1%, attendance changes -18.3%, and total beer consumption changes +63.7%.
- At $6, tickets change +58.6%, attendance changes -37.4%, and total beer consumption changes +90.2%.
- At $5, tickets change +68.3%, attendance changes -41.1%, and total beer consumption changes +93.2%.
6.3 Comparative Statics
7 Robustness
The robustness checks ask whether the sign pattern survives parameter perturbations rather than treating any single calibration as definitive. The ticket-markup condition above is the formal mechanism used in the paper. The most important stress tests vary the private crowd-cost calibration and ticket repricing flexibility, because those assumptions govern how strongly the venue moves from the beer margin to the ticket margin.
The qualitative results are informative, but not unconditional.
The first check varies one parameter at a time without recalibrating the other moments. This is not a probability model over parameters; it is a transparent stress test around the benchmark, including low internal crowd-cost cases where the ticket response is mechanically weaker.
| Parameter | Range | Ticket | Attendance | Beers |
|---|---|---|---|---|
| Drinker share | 30% to 50% | +40.5% to +75.0% | -44.8% to -27.7% | +82.7% to +94.2% |
| Drinker consumption target | 2.0 to 3.5 beers | +43.1% to +67.0% | -38.9% to -29.1% | +74.5% to +92.7% |
| Ticket-price sensitivity | 0.010 to 0.016 | +37.9% to +71.9% | -45.4% to -25.6% | +84.8% to +90.6% |
| Internal crowd cost | 0 to 160 | +14.0% to +68.6% | -43.0% to -0.0% | +45.3% to +148.7% |
| Beer cap | 5 to 10 beers | +42.3% to +58.6% | -37.4% to -26.1% | +77.5% to +90.2% |
| Beer marginal cost | $1.50 to $2.50 | +57.5% to +59.7% | -38.0% to -36.9% | +86.7% to +93.8% |
The next check constrains ticket repricing under the $6 ceiling. Beer consumption still rises when ticket repricing is limited, but the profit effect becomes much larger because the venue cannot fully move to the unconstrained ticket margin.
| Ticket case | Ticket | Attendance | Beers | Profit |
|---|---|---|---|---|
| No ticket increase | $80.00 | +16.1% | +252.7% | -52.3% |
| 10% ticket cap | $88.00 | +4.4% | +217.4% | -39.8% |
| 25% ticket cap | $100.00 | -10.8% | +171.0% | -27.6% |
| Full repricing | $126.88 | -37.4% | +90.2% | -18.9% |
Each Monte Carlo draw independently varies the drinker share from 30% to 50%, drinker beer demand from 2.0 to 3.5 beers at the benchmark price, the beer cap from 5 to 10 beers, ticket cost from $3.00 to $4.00, beer cost from $1.50 to $2.50, the internal crowd cost from 0 to 160, ticket-price sensitivity from 0.010 to 0.016, the crime externality from $1.50 to $3.50 per beer, and the health externality from $1.00 to $2.00 per beer.
Across 1,000 draws, ticket prices rise in 95% of draws and total beer consumption rises in 95% of draws. Profit falls in 92% of draws, which is mostly a feasibility check because the ceiling constrains the venue’s choice set. Social welfare falls in 94% of draws.
- Intensive margin: +165.7% of baseline beer consumption.
- Extensive margin: -75.6% of baseline beer consumption.
- Monte Carlo ticket-price change p10/p50/p90: +0.5%, +37.2%, +76.3%.
- Monte Carlo beer-consumption change p10/p50/p90: +1.1%, +68.5%, +91.9%.
- Monte Carlo welfare change p10/p50/p90: -37.2%, -19.4%, -0.0%.
8 Limitations
- The paper is a calibrated mechanism exercise using public price and attendance targets rather than proprietary transaction-level Yankees data.
- The demand side uses two consumer types, which captures composition effects but not the full distribution of fan preferences or outside options.
- The model is static and partial-equilibrium, so it abstracts from pregame drinking, nearby bars, repeat attendance, and long-run reputation effects.
- The policy experiments assume perfect enforcement and do not model evasive responses such as flask-smuggling, bootlegging, or accelerated pregame drinking in response to the ceiling.
- The benchmark ticket increase depends materially on calibrated private crowd-management and experience-degradation costs; low-cost variants are reported as stress tests rather than ruled out by direct Yankees data.
- The ticket price is assumed to be freely re-optimized for the representative game; the model abstracts from season tickets, resale markets, dynamic pricing frictions, and fan backlash from sudden repricing.
- Attendance is capped at stadium capacity, but the main ceiling counterfactuals only move attendance downward, so the paper is not informative about policies that would push demand back against the capacity constraint.
- External costs are imported from the alcohol-policy literature rather than estimated around Yankee Stadium itself.
9 Data and Code Availability
All code needed to regenerate the paper tables, figures, submission metadata, and web-app data lives in the accompanying Python package at https://github.com/maxghenis/yankee-stadium-beer-price-controls. The model uses public concession-price reporting and literature-based calibration moments rather than proprietary Yankees transactions. Generated artifacts are rebuilt from package commands so the manuscript and outputs can be reproduced without notebooks or ad hoc scripts. A tagged release or archival DOI should be added to this statement before journal submission.
10 Declarations
Funding: none. Competing interests: none. Human subjects: the paper uses a calibrated model and public or literature-based inputs; it does not analyze individual-level human-subjects data.
11 Conclusion
Beer price ceilings look appealing as a consumer-protection intervention because they target a conspicuous markup. But once the stadium is modeled as an integrated seller of tickets and concessions, that intuition weakens sharply. Within this calibrated model, a binding ceiling lowers beer prices and raises ticket prices enough to shrink attendance, change crowd composition, and increase total beer consumption rather than reduce it.
That does not mean current pricing is socially optimal. It suggests that, within this model, a beer ceiling may be poorly targeted if the objective is to reduce external harms. If the policy objective is to reduce crime, crowding, or public-health spillovers, those margins should be targeted directly.
12 Appendix
12.1 Calibration Targets and Fitted Values
| Moment | Target | Model | Notes |
|---|---|---|---|
| Ticket price | $80.00 | $80.00 | Direct benchmark target |
| Beer price | $12.50 | $12.50 | Direct benchmark target |
| Attendance share | 85.0% | 85.0% | Capacity utilization target |
| Beers per attendee | 1.00 | 1.00 | Aggregate consumption target |
| Beers per drinker | 2.50 | 2.50 | Type-specific consumption target |
| Ticket elasticity at $80 | n/a | -1.05 | Implied by calibrated attendance sensitivity |
12.2 Main Policy Cases
| Case | Ticket | Beer | Attendance | Drinker Share | Total Beers |
|---|---|---|---|---|---|
| Baseline | $80.00 | $12.50 | 39,556 | 40.0% | 39,556 |
| $10 ceiling | $88.29 | $10.00 | 36,885 | 42.3% | 52,680 |
| $8 ceiling | $101.70 | $8.00 | 32,322 | 44.8% | 64,756 |
| $6 ceiling | $126.88 | $6.00 | 24,752 | 48.3% | 75,221 |
| $5 ceiling | $134.63 | $5.00 | 23,311 | 50.4% | 76,423 |